Is the Bitcoin 4-year cycle broken? Explore an in-depth empirical analysis comparing the 2016, 2020, and 2024 halving cycles using a normalized Dual-Y model to predict the upcoming macro bottom.
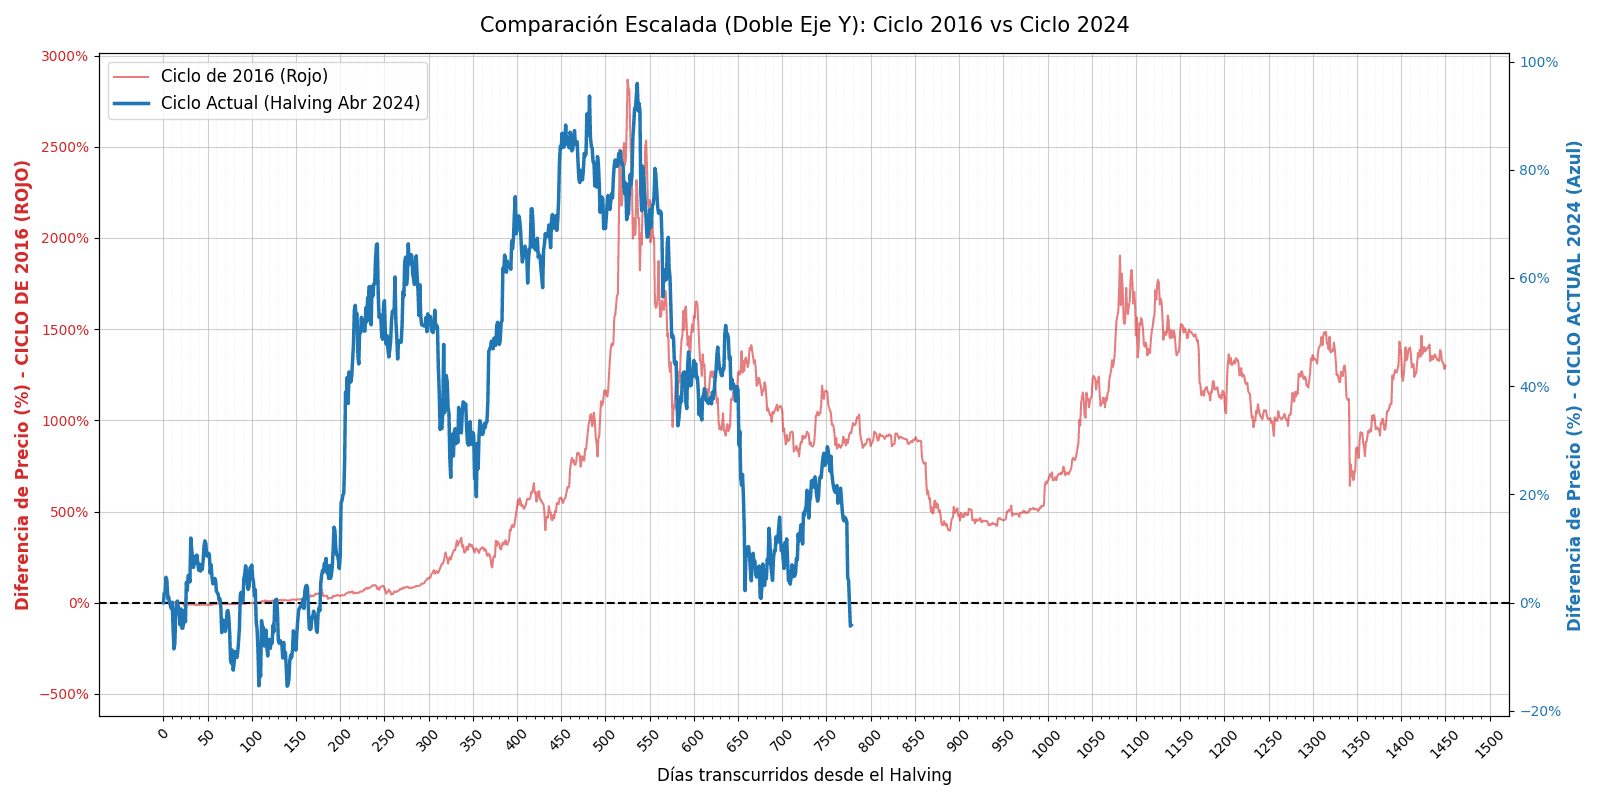
For years, the digital asset market has debated whether Bitcoin’s historical four-year halving cycles are dampening, lengthening, or breaking entirely. On the surface, the 2024 post-halving performance looks drastically different from its predecessors. While older cycles delivered explosive, multi-thousand percent parabolic rallies, the current cycle peaked at just under +100% relative to its halving price before entering a grueling macro correction.
However, focusing solely on nominal percentage gains creates a visual illusion that masks a profound structural truth. When we strip away the noise of fiat valuation and normalize the magnitude of these market cycles using a Scaled Dual-Y Axis Model, we unlock a stunning realization: the algorithmic choreography of Bitcoin’s market cycles remains mathematically intact.
Here is a rigorous, data-driven analysis of where we stand today near Day 777, why the widely discussed "cycle drift" is a statistical myth, and how we can use historical temporal synchronization to pinpoint the upcoming macro bottom window.
In traditional comparative charts, plotting a +2,800% cycle alongside a +100% cycle crushes the smaller trend line into a flat, unreadable whisper. This structural compression forces analysts into the false conclusion that the current market behaves differently than the past.
By isolating the cycles on separate vertical axes while anchoring them to a shared 0% horizontal baseline on Day 0 (the Halving), we expose the pure temporal rhythm of the network. To build a bulletproof case, we must analyze the exact peak formations across three vastly different macroeconomic epochs: the retail-driven 2016 cycle, the pandemic-fueled 2020 cycle, and the institutional ETF-driven 2024 cycle.
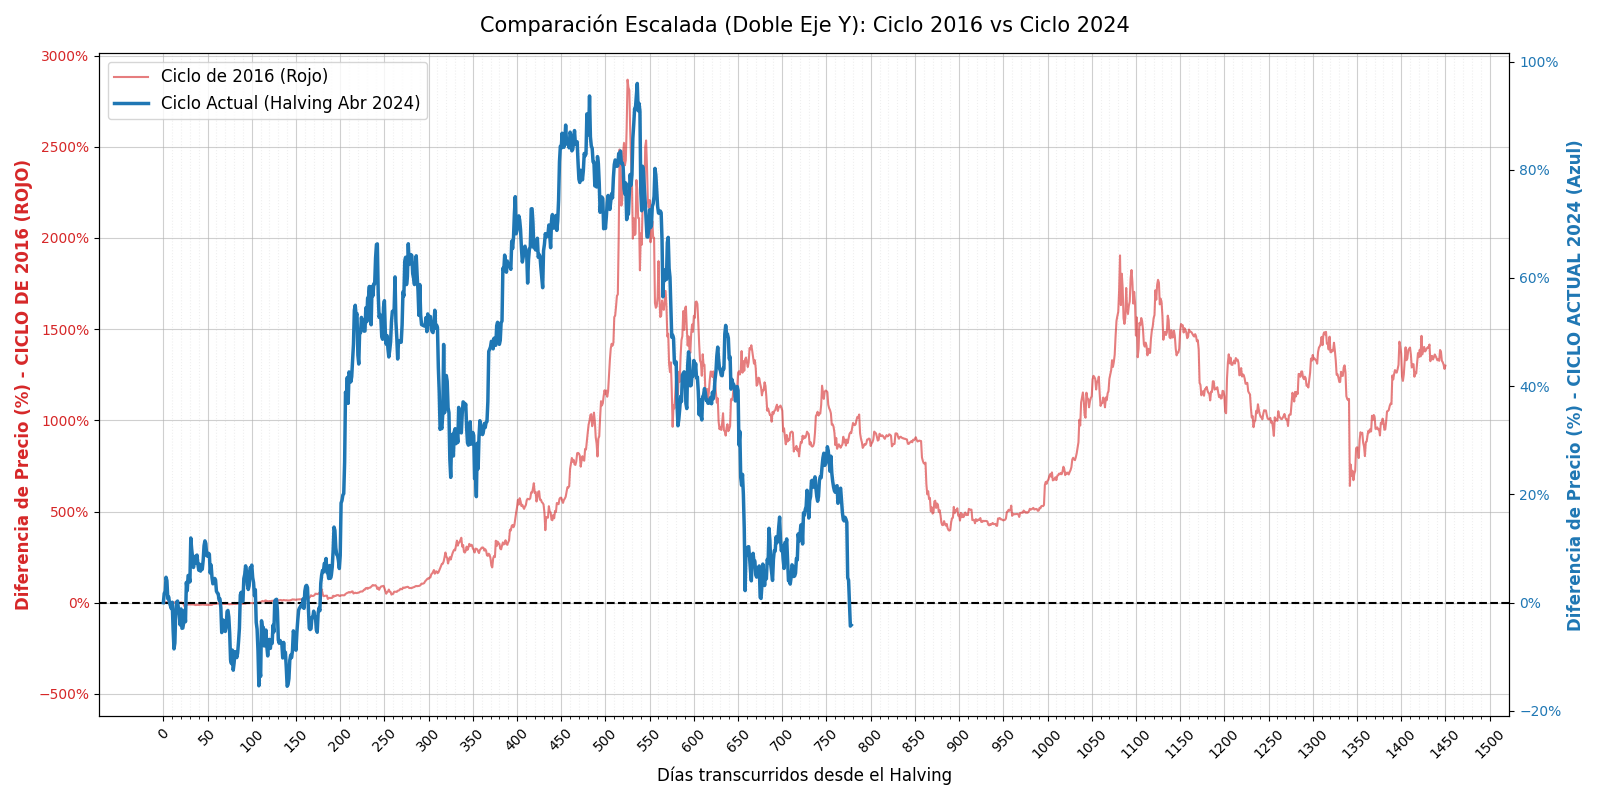
In 2016, Bitcoin experienced a staggering macro rally, peaking at +2,868%. Yet, when we scale this cycle (red) alongside our current 2024 cycle (blue), the structural mimicry of the price action—the distribution phases and violent drawdowns—is undeniable.
More importantly, the empirical data shows that the absolute peak of the 2016 distribution phase formed exactly on Day 525 post-halving.
Crypto media widely proclaimed that the 2024 cycle was fundamentally altered—or "front-run"—because Bitcoin broke its previous All-Time High before the halving event. However, when we apply our dual-axis normalization to the 2020 dataset (which peaked at +689%), the narrative of cycle drift completely collapses.
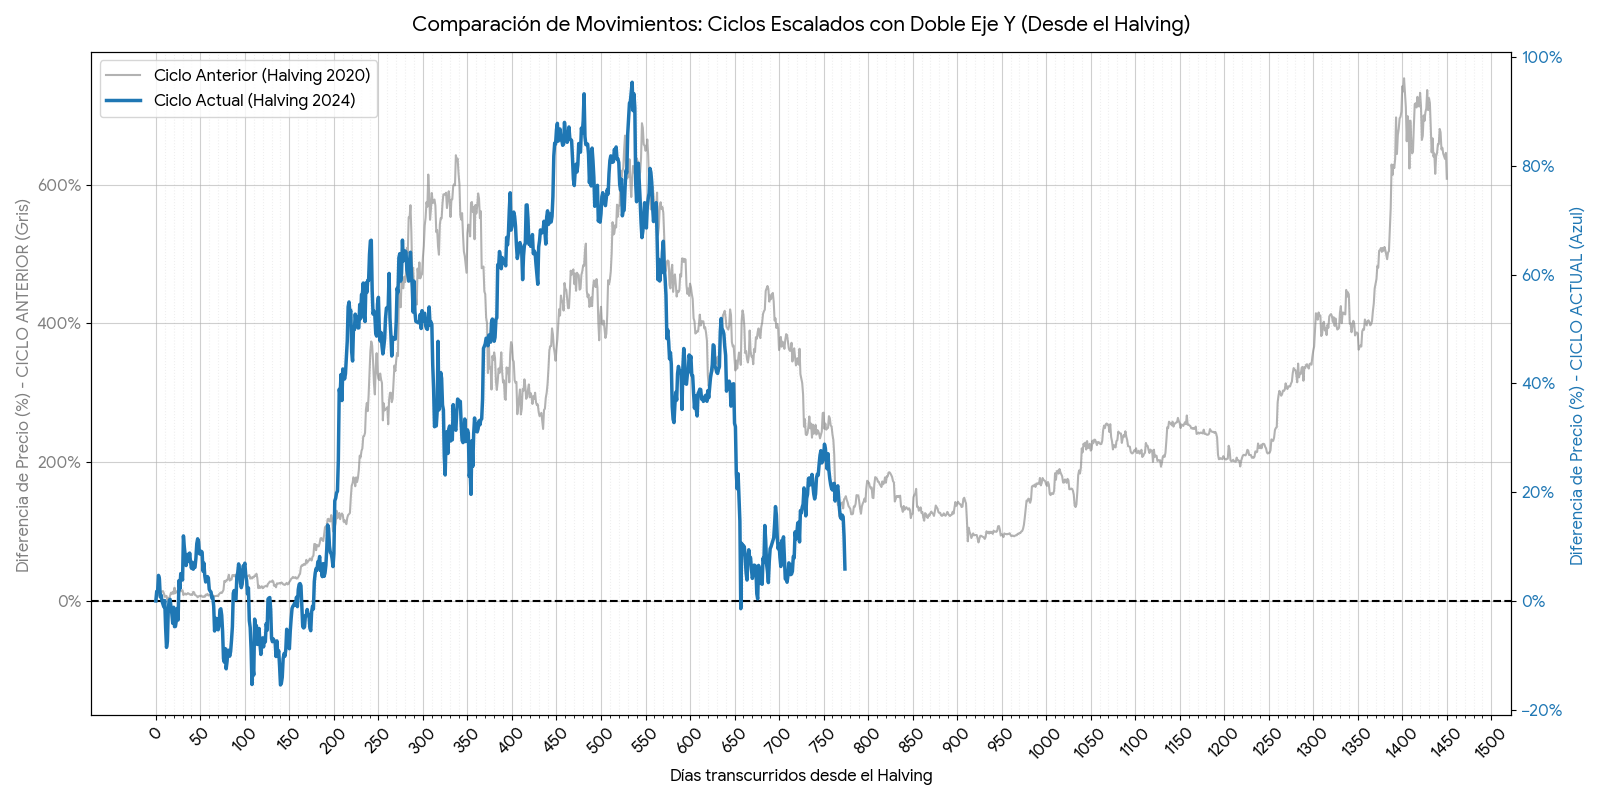
When we extract the precise days of the absolute peaks across these last three macro epochs, a stunning mathematical alignment emerges:
Rather than drifting or breaking, the 2024 peak (Day 536) landed almost perfectly in the mathematical center of the 2016 and 2020 peaks. All three generational tops occurred within a microscopic 21-day window (Days 525–546).
A variance of just 21 days across a 1,450-day macroeconomic cycle is statistically negligible. It proves that despite massive institutional inflows and shifting global liquidity, Bitcoin’s internal clock continues to dictate market psychology with absolute efficiency.
As we navigate through June 2026, we have crossed the Day 777 threshold since the April 19, 2024 halving.
Current Coordinate: Day 777 Post-Halving (Phase: Bear Market Grind / Late Distribution)
Following the mathematically punctual macro top on Day 536, Bitcoin entered its standard cyclical capitulation phase. By cross-referencing our current coordinates with historical baselines, we can map out the structural expectations for the immediate future:
The ultimate utility of a time-synchronized cyclical model is its ability to project future structural turning points. Because the current cycle continues to mirror the temporal layout of its predecessors with such high fidelity, we can calculate a highly specific countdown to the ultimate macro accumulation zone.
In previous cycles, the definitive, generational market bottom formed within a strict boundary between Day 910 and Day 975 post-halving. This is the window of absolute despair where the final weak hands capitulate.
Projecting forward from our current Day 777 coordinate, we establish the following timeline for the 2026 cycle bottom:
For long-term investors and systematic allocators, this empirical data translates into actionable, rule-based strategies:
Bitcoin isn't breaking its script; it's simply playing it out on a different financial scale. The clock is ticking toward the next generational accumulation zone.
Disclaimer: This analysis is provided for informational and educational purposes only. It does not constitute financial, investment, or legal advice. Digital assets are highly volatile; always conduct your own research before deploying capital.
